Urban Growth
Nairobi is becoming a network of cities

Direct answer
The argument in brief.
Nairobi is no longer adequately described as one centre surrounded by suburbs. Employment, housing, retail, logistics, diplomacy, education, and leisure are increasingly organised across specialised nodes whose value depends on their connections to the wider metropolitan system.
Nairobi is not simply getting bigger around one centre. It is becoming a network of places with different roles, different rhythms, and different development logics.
The familiar map of Nairobi begins with the central business district and reads everything else by distance from it. That remains useful, but increasingly incomplete. Employment, housing, retail, logistics, diplomacy, education, and leisure have been reorganising across multiple nodes.
This visual essay is a way of thinking through that change. It is not a forecast map or a claim that every labelled location will become an equivalent city centre. It is a proposition: development is better understood through networks of access, demand, infrastructure, capital, and specialised activity than through the simple expansion of one core.
The next important location may not be the closest to the old centre. It may be the one that becomes most useful to the emerging network.
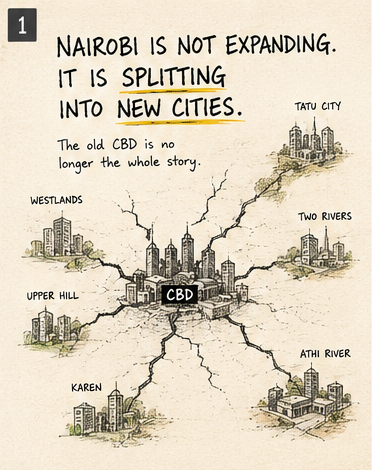
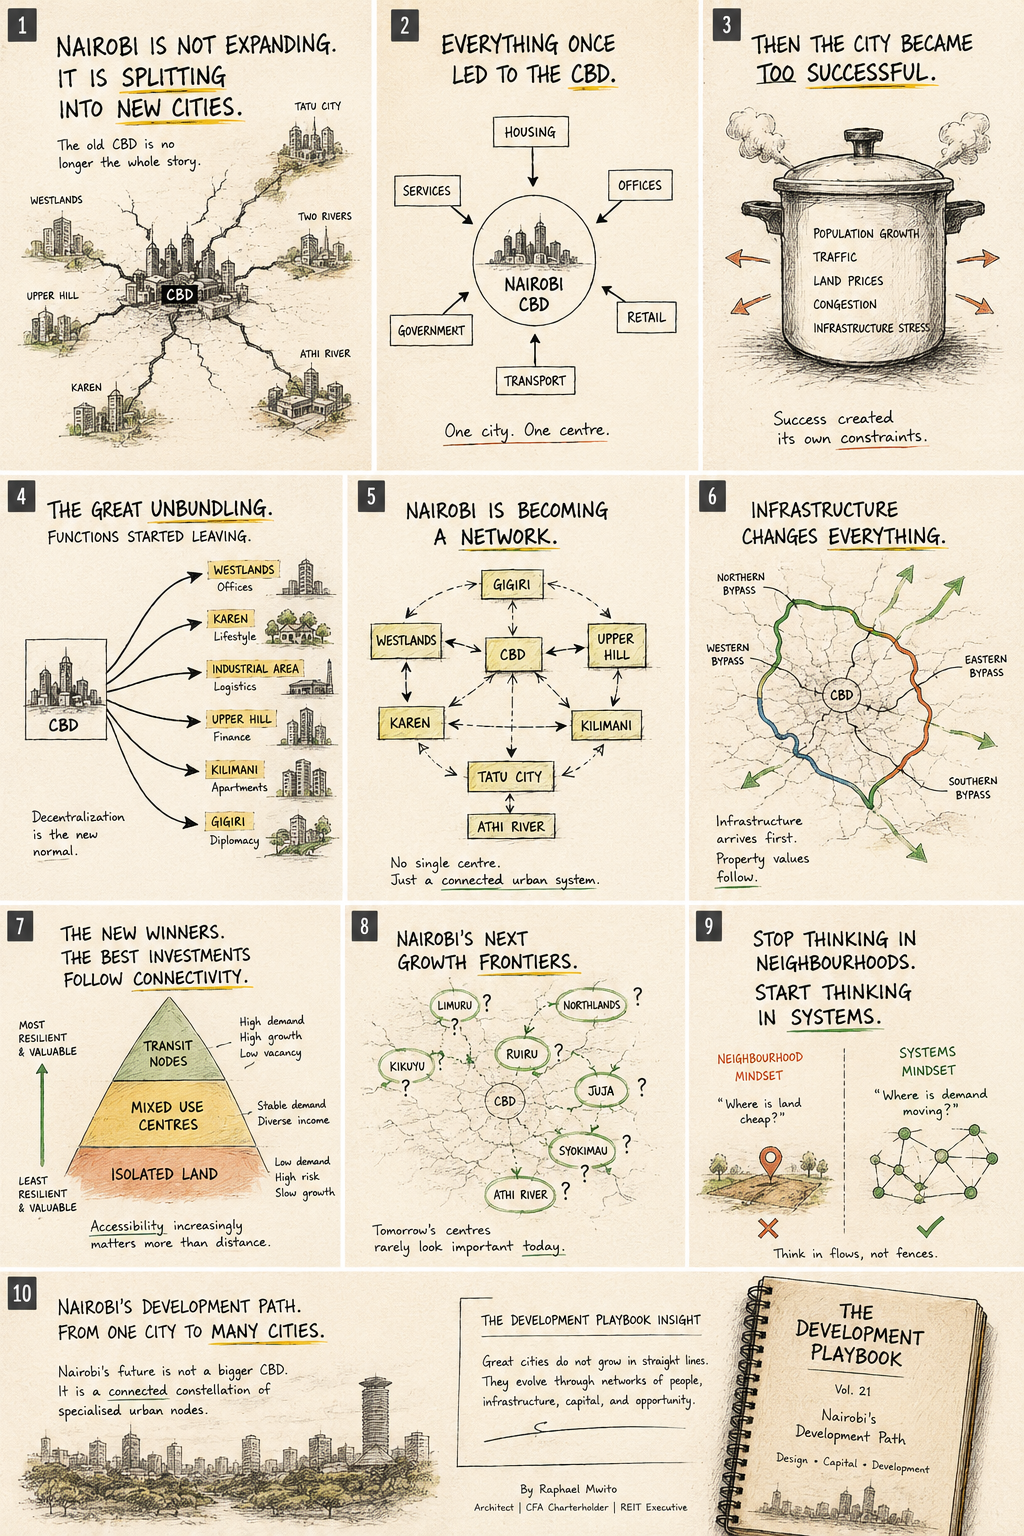
The old CBD is no longer the whole story.
Nairobi’s growth is increasingly distributed across specialised centres. Westlands, Upper Hill, Kilimani, Karen, Gigiri, Athi River, and newer planned nodes do not simply extend the historic centre; they organise different combinations of work, housing, services, logistics, diplomacy, and leisure.
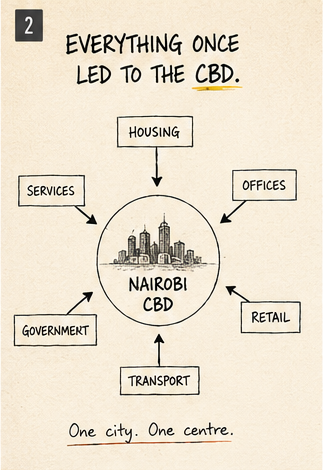
The monocentric city was easier to describe.
A single dominant centre creates a clear spatial hierarchy: major employment, government, retail, and services pull movement inward. That model still matters, but it no longer explains enough of Nairobi’s daily geography.
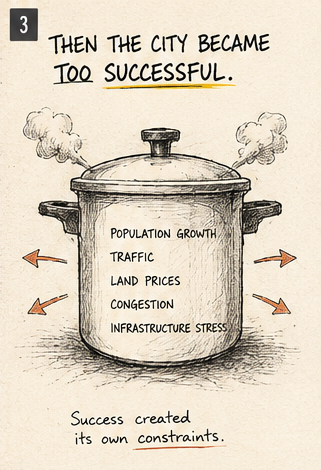
Concentration created its own constraints.
Population growth, congestion, land prices, infrastructure pressure, and long journeys made decentralisation economically attractive. Success at the centre helped produce demand for alternatives beyond it.
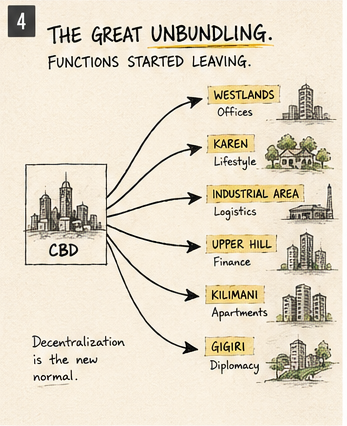
Functions began to unbundle.
Different nodes developed recognisable roles: offices, finance, logistics, apartments, diplomacy, retail, and lifestyle. These identities are never pure, but they influence demand, rents, development form, and the kind of capital each place attracts.
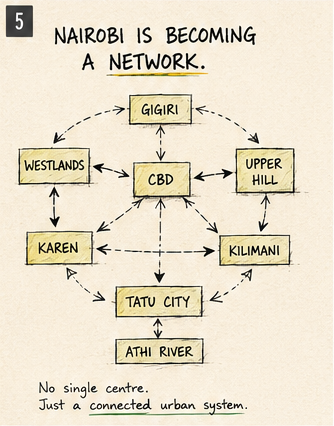
The useful unit is now the network.
No node operates alone. Residents, workers, customers, goods, information, and investment move between them. A development decision should therefore ask not only what exists nearby, but how the location participates in the wider urban system.
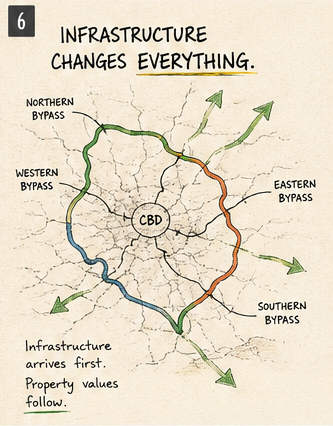
Infrastructure rearranges possibility.
Bypasses and major transport investments change travel patterns, reveal new catchments, and alter the relative accessibility of land. They do not guarantee value, but they can materially change where value has a chance to emerge.
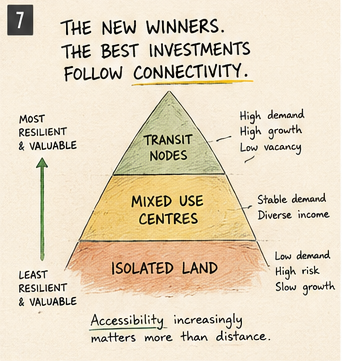
Connectivity changes the investment hierarchy.
Isolated inexpensive land can remain inexpensive for good reason. Mixed-use centres and connected transit nodes may support more resilient demand because they combine access, services, activity, and multiple reasons to be there.
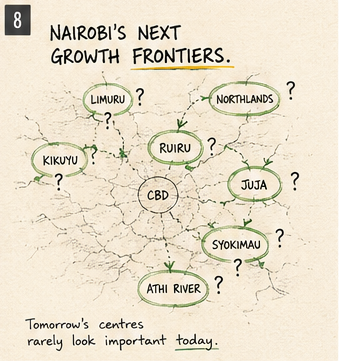
Tomorrow’s centres rarely look important today.
Growth frontiers should be treated as questions, not predictions. The relevant test is whether access, infrastructure, employment, services, land assembly, governance, and sustained demand are beginning to reinforce one another.
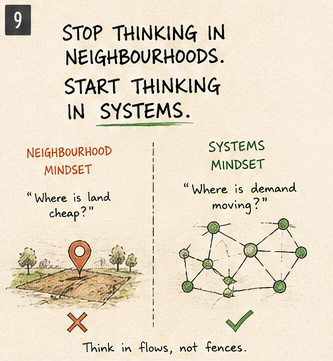
Move from neighbourhood thinking to systems thinking.
The question “Where is land cheap?” is incomplete. A stronger question is “Where are demand, mobility, infrastructure, institutions, and capital moving—and what role could this site play within those flows?”
A six-part node test
Do not confuse a named place with a functioning urban node.
A node is not made important by a marketing name, one road project, or a cluster of speculative buildings. Its case becomes stronger when several systems begin to reinforce one another.
01
Purpose
What durable activity makes this node useful—employment, logistics, education, government, retail, health, leisure, or a credible combination?
02
Access
Which journeys are becoming easier in actual travel time, reliability, and cost, rather than only appearing shorter on a map?
03
Infrastructure
Can water, power, sewerage, roads, drainage, digital connectivity, and public services support the proposed intensity?
04
Market depth
Are there enough real households, firms, tenants, buyers, and repeat transactions to support the product beyond one launch cycle?
05
Institutional momentum
Are planning, approvals, land assembly, public investment, and major anchors reinforcing the same direction?
06
Everyday completeness
Can people live, work, learn, shop, and access services without every trip returning to the historic centre?
10 / From one city to many cities
The development implication is not to chase every frontier.
A network view does not make location analysis easier. It makes it more demanding. It asks whether a node has a durable role, whether access is improving in practice, whether infrastructure can support the proposed intensity, and whether demand comes from real users rather than a story repeated by land sellers.
It also changes what should be compared. A proposed office building in Upper Hill should not be understood only against other nearby offices. Its case is affected by how firms, employees, transport, amenities, and competing employment nodes are moving across the metropolitan system. The same is true for apartments, retail, logistics, and mixed use.
The strongest investment locations are likely to combine a clear purpose with increasing connectivity. Distance still matters. But accessibility, network position, institutional momentum, and the ability to support everyday life may matter more.
This also changes the sequence of due diligence. Begin with the role the node performs, then test the flows that sustain it, the infrastructure that limits it, and the users who pay for it. Only then should land price be compared with development capacity. Cheap land at the edge of a weak network may be expensive once time, infrastructure, absorption, and operating friction are priced honestly.
Downloadable visual artefact
The complete Nairobi visual argument.
All ten illustrated panels assembled as one high-resolution plate for closer inspection, presentation, or reference.
Evidence note
A visual thesis should make its level of certainty visible.
The plate combines observed decentralisation with interpretive claims about connectivity and future growth. Before publication as research, the next version should cite employment distribution, transport investment, land and rental trends, population change, planning policy, and project pipelines.
The locations shown as possible growth frontiers are prompts for investigation rather than investment recommendations. Their prospects depend on infrastructure delivery, governance, environmental capacity, affordability, market depth, and the quality of actual development.
Sources and notes
Evidence behind the argument.
Nairobi City County
Official context on Nairobi’s development priorities, public investment planning, and county-wide spatial needs.
UN-Habitat
Urban-sector context covering planning, infrastructure, governance, economy, housing, and services.
Related tool
Site Acquisition Go/No-Go CalculatorRelated essay
Architecture after the feasibilityRelated topic
Nairobi apartment developmentAuthor note
Written by Raphael Mwito from the combined perspective of architecture, finance, real estate investment, and development practice.
About the author →